Finally got around to publishing the Cartagen developer API.

Josh Levinger of GroundTruth and I tested our larger 8 foot balloon yesterday, and it was a huge success! We ran all the way through our spool of string, and got some great images before the light got too dim. I rectified them using Map Warper (fantastic!) and we now have a mostly continuous ‘scan’ of our flight.

This means this can be a viable way to capture high-resolution geolocated imagery at low cost! I spent under $100 on the equipment – $30 for the balloon, $40 for the camera, $5 for the helium, and a few bucks for string. I bet it could be done for under $50 with a cheaper camera and perhaps trash bags instead of latex balloons. We’ll be trying that soon – I’d guess we need about 10 of these 98-gallon bags. I also turned the ISO way up for this because the light was failing, so the photos are pretty grainy. This camera doesn’t have shutter speed settings, though I’m still playing around with the CHDK settings so maybe I’ll do better next time.
I’m excited to test this in an area that really does not have good aerial imagery, like outside Lima, Peru.
See all the pictures at full resolution here: Balloon aerial photography on Flickr
See some great photos from the ground by Christina Xu on Flickr


Playing with Map Warper (see recent post) and trying to rectify drawn maps for inclusion in Cartagen. Doesn’t work that well… the warper assumes smooth distortions, not ones based on people’s semantic and decidedly qualitative understanding of space. An alternative stretching algorithm might be interesting… regardless Map Warper should work well with balloon photography. More soon.
Continue reading “Map Warper with Cartagen – rectified sketches on dynamic maps”

A New York-based anarchist has been arrested by the FBI and charged with hindering prosecution after he allegedly used the social networking site Twitter to help protesters at the G20 summit in Pittsburgh evade the police.
Elliot Madison, 41, from Queens, had his home raided and was put on $30,000 (£19,000) bail after he and Michael Wallschlaeger, 46, were tracked to the Carefree Inn motel in Pittsburgh during the summit on 24 and 25 September.
The pair were found sitting in front of a bank of laptops and emergency frequency radio scanners. They were wearing headphones and microphones and had many maps and contact numbers in the room.
Official police documents allege the two men used Twitter messages to contact protesters at the summit “and to inform the protesters and groups of the movements and actions of law enforcement”.
In all, almost 200 protesters were arrested during the two-day summit, which brought world leaders to Pittsburgh to discuss the global economic meltdown and other matters of common financial interest.
I just tested the native JSON parser in Safari (this is also implemented in Firefox now, and IE8) and it dramatically speeds up the parsing of Cartagen’s JSON data files! Take a look at these times for parsing six typical data plots in milliseconds:
prototype.js’s .evalJSON():
parsed: 43
parsed: 7
parsed: 47
parsed: 63
parsed: 37
parsed: 53
Native JSON.parse():
parsed: 8
parsed: 6
parsed: 6
parsed: 9
parsed: 5
parsed: 7
That’s a sixfold improvement!
And for Firefox 3.5:
prototype.js’s .evalJSON():
parsed: 174
parsed: 157
parsed: 198
parsed: 349
parsed: 155
parsed: 455
parsed: 323
parsed: 276
parsed: 272
Native JSON.parse():
parsed: 13
parsed: 13
parsed: 14
parsed: 20
parsed: 12
parsed: 25
parsed: 20
parsed: 18
parsed: 18
That’s more than 15 times the speed!
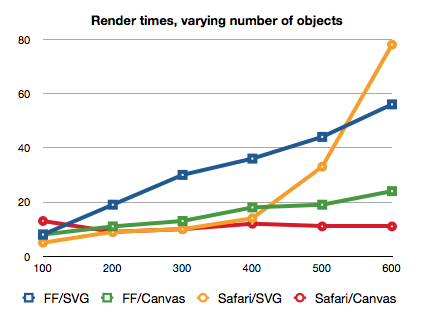
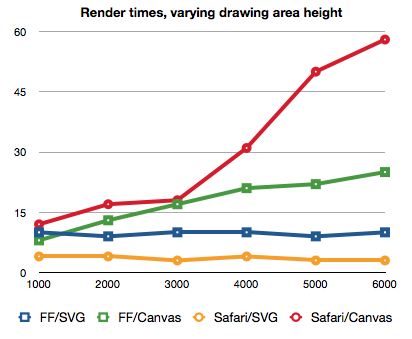
Well, SVG doesn’t scale well to large numbers of objects, but Canvas doesn’t scale well to large screens:
Here are the results of the first fruitful experiment, which clearly shows that SVG performance degrades quickly (exponentially on Safari?) in the number of objects, but Canvas performance remains at a near-constant low. This makes sense, since Canvas is just a bitmap buffer, while SVG has to maintain additional references to each object that it renders. Also, though not pictured, note that performance in clearing an SVG element also decreases in the number of drawn objects.
Via Boris Smus
OpenStreetMap.org‘s RESTful API allows anyone to access data on their continually growing collaborative map of the world… in XML. This is great for most applications, but if you’re working in JavaScript (as we are), XML might as well be greek. We need JSON.
To offer OSM-JSON along with of OSM-XML, we added a route to accept a “.format” suffix, and split up the render call based on the params[:format] part of the route:
# /config/routes.rb:46-50

map.connect "api/#{API_VERSION}/geohash/:geohash.:format", :controller => 'api', :action => 'geohash'
map.connect "api/#{API_VERSION}/geohash/:geohash", :controller => 'api', :action => 'geohash'

map.connect "api/#{API_VERSION}/map.:format", :controller => 'api', :action => 'map'
map.connect "api/#{API_VERSION}/map", :controller => 'api', :action => 'map'
Notice we also added a ‘geohash’ route. Whereas the /map call requires a bbox parameter (‘bbox=min_lon,min_lat,max_lon,max_lat’), we can use a geohash (Geohash in JavaScript, Geohash in Rails) which defines a bounding box as a sequence of letters and numbers. This fits Cartagen’s needs well, and since it doesn’t require any parameters, we can page cache it in Rails. (Remember that page caching bypasses Rails entirely, letting Apache handle these cached files at high speed – that saved us when we were on BoingBoing).
Continue reading “Serving ‘OSM-JSON’ alongside XML from the OpenStreetMap Rails port”

We know we just released Cartagen 0.5 a couple weeks ago, but after testing it extensively in the wild, we really wanted a fast, low-resource release so that users of netbooks, older computers, and older browsers could use Cartagen too.
So, as well as including some general cleanup, this version hums along on a variety of machines. Please send feedback on speed/load times/CPU usage, etc; we tested it on an 800mhz G4 iMac and while it wasn’t super responsive, it did load and was somewhat usable in Firefox 3.5. For reference, Hulu.com’s Flash player does not run on that machine. On more powerful machines (4x3ghz Intel Xeon, 2500×1600 monitor), it can load over 10,000 objects in the viewport without hiccuping. For most users, a typical browser window size yields a responsive and reasonably low-resource experience.
Download Cartagen 0.6.1 (We did 0.6 and just rushed directly into 0.6.1 before announcing.)
There’s definitely a lot more we can do to improve speed, but for now we feel good about our optimizations. We identified the high CPU usage as generally poor management of timers in JavaScript, and wrote a TimerManager class which adjusts its timer intervals automatically, easing the CPU load. We elected to maintain a relatively high CPU usage to keep things rendering smoothly, but users of TimerManager can ‘turn up the heat’ or turn down CPU usage by tweaking a ‘spacing’ parameter. We also broke more intense tasks up by creating a TaskManager class, which preserves UI responsiveness and framerate while staying in a single JavaScript thread. We plan to use the multithreaded, asynchronous Web Workers spec in HTML5 when available, but for now we wanted to work on older hardware/software.
We hope that TimerManager and TaskManager will be of use to others working with JavaScript animation and we’ll be packaging them up separately for download.
For now, look at http://code.google.org/p/cartagen for source and http://wiki.cartagen.org for update docs.
Today we’d like to announce the 0.5 release of the dynamic mapping framework Cartagen. In this release, we’ve taken a shot at rendering any location on the planet (drawing, of course, on data from OpenStreetMap), and at rendering a much greater density of map features with richer styles. The has come a long way, and we hope it makes designing your own map easier while allowing even greater possibilities for unique and compelling designs.
This is the first release we consider to be useable by the general public; as such we are releasing a video to demonstrate how to download Cartagen, get a data set, and write your own GSS stylesheet in just a few minutes:
More information and setup instructions are on Cartagen’s wiki, and our live demonstration site at cartagen.org has been updated.
Cartagen is still incomplete: it needs more optimization for slower browsers and devices like the iPhone and Android phones, it can make better use of HTML5 features such as Web Workers for multi-threaded JavaScript for a more responsive UI, and we hope to continue our early efforts to combine it usefully with OpenLayers and other mapping platforms.
Special thanks to Ben Weissmann who’s joined the Cartagen team and has been instrumental in bringing it this far.